Whisper · Docs
Console

Graph explorer

Start with one node and expand the internet. Explore is an interactive view over the Whisper security graph: seed it with a domain, IP, network, or organization, then walk the connected infrastructure.

1 · Start with a seed

Explore opens on a single prompt. Type any indicator, a domain, an IP, a network, or an organization, or pick a quick-start chip, and the console pulls that node and its immediate neighbours onto the canvas.
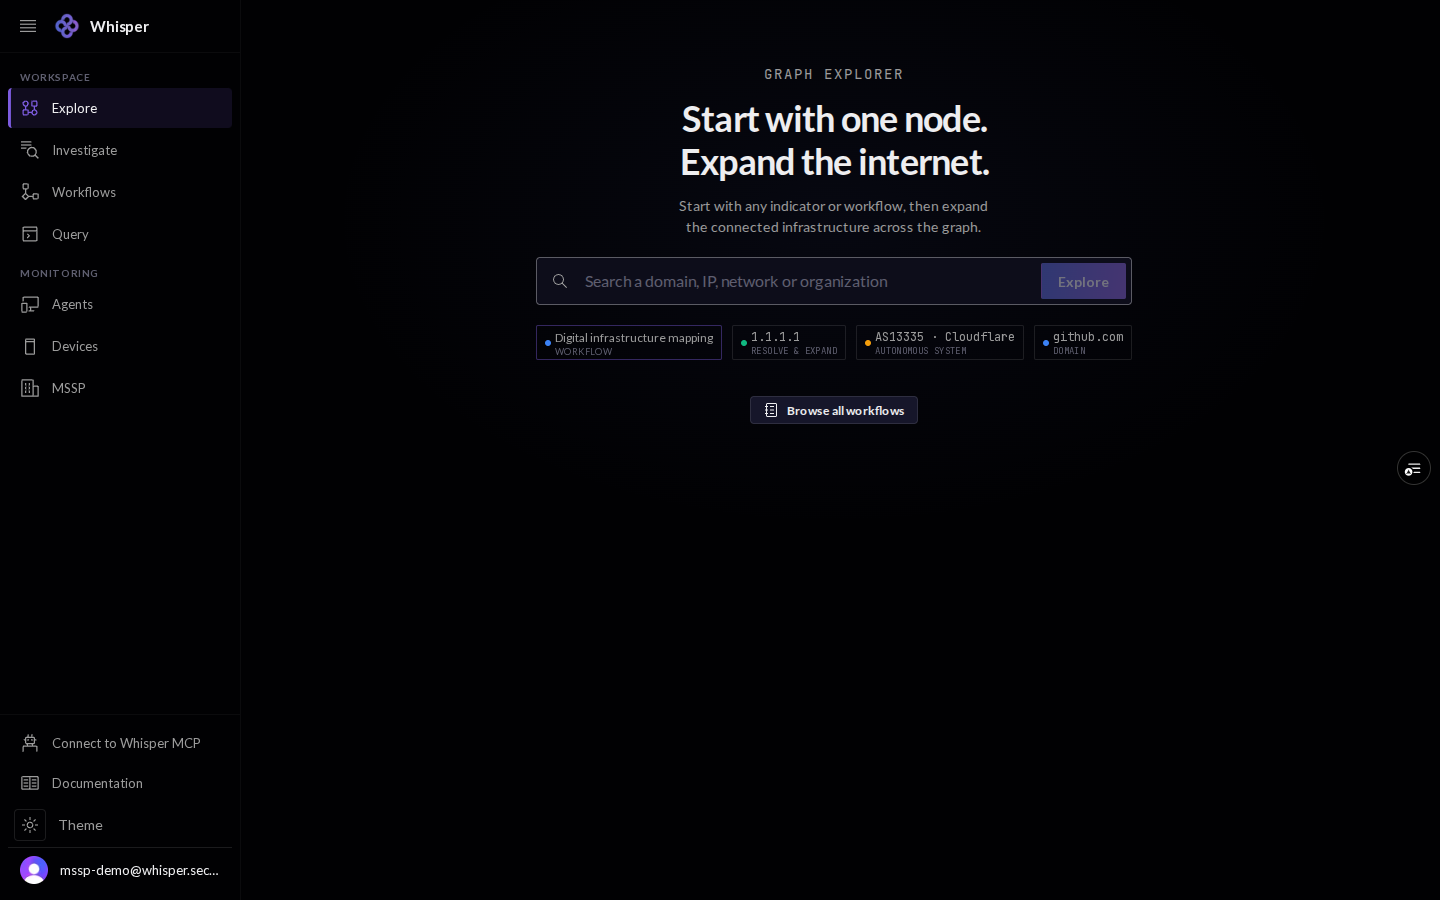
The Explore start screen: a headline reading Start with one node, expand the internet, a search box for a domain, IP, network, or organization, and quick-start chips.
Explore opens empty. Seed it with any indicator, or pick a quick-start chip.
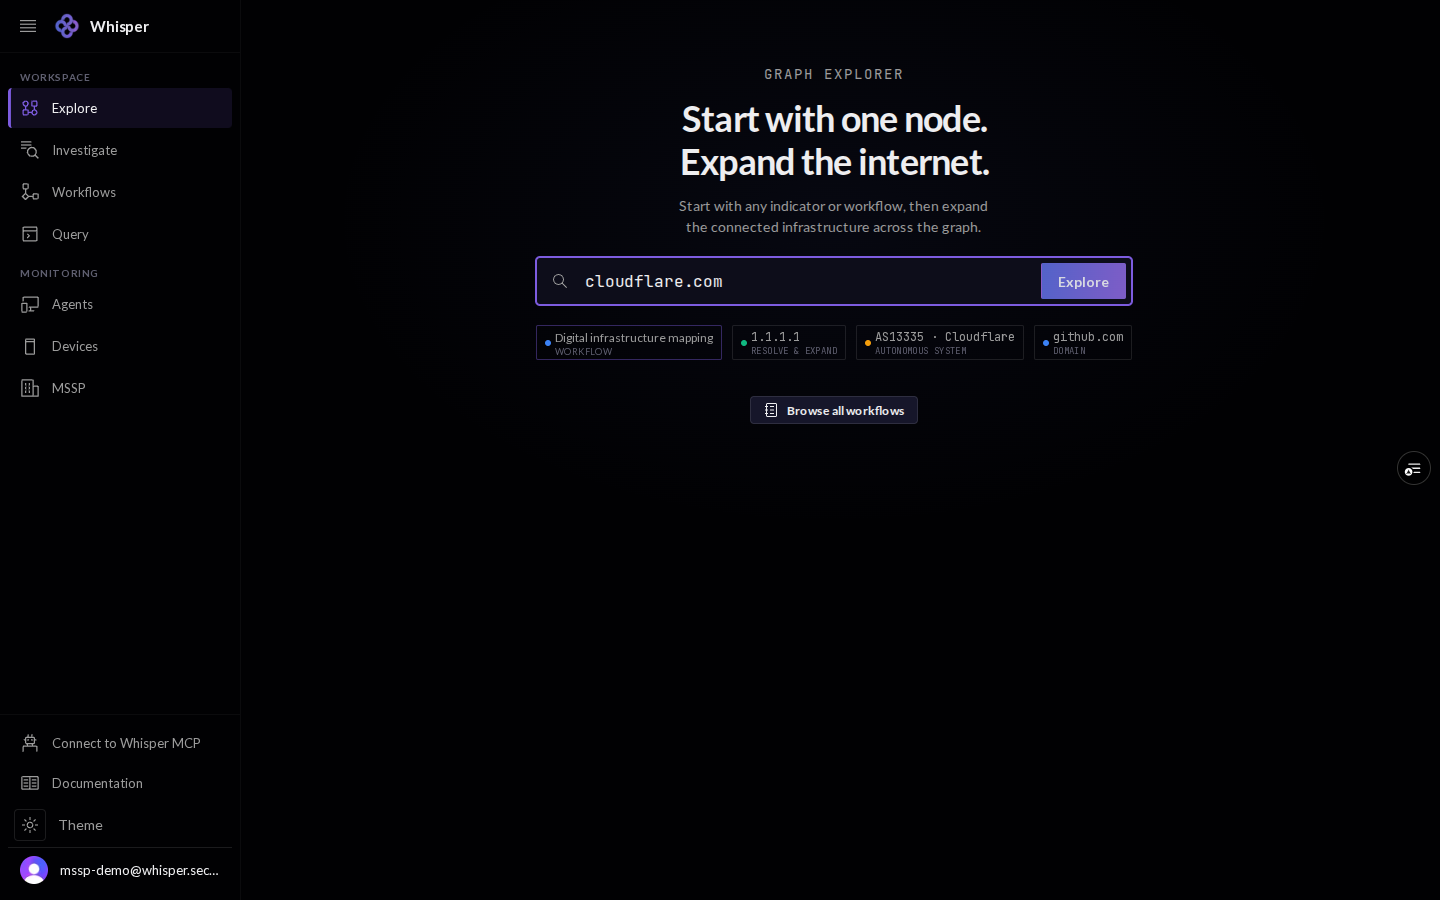
The Explore search box with a domain typed in, ready to expand into the graph.
Type a domain, IP, network, or organization and press Explore.

2 · The graph

The canvas is a live, navigable graph. The toolbar carries Bulk Expand, Run Workflow, a type filter, the layout picker, and the 3D / 2D / Table switch; the status bar counts nodes and edges as the graph grows.
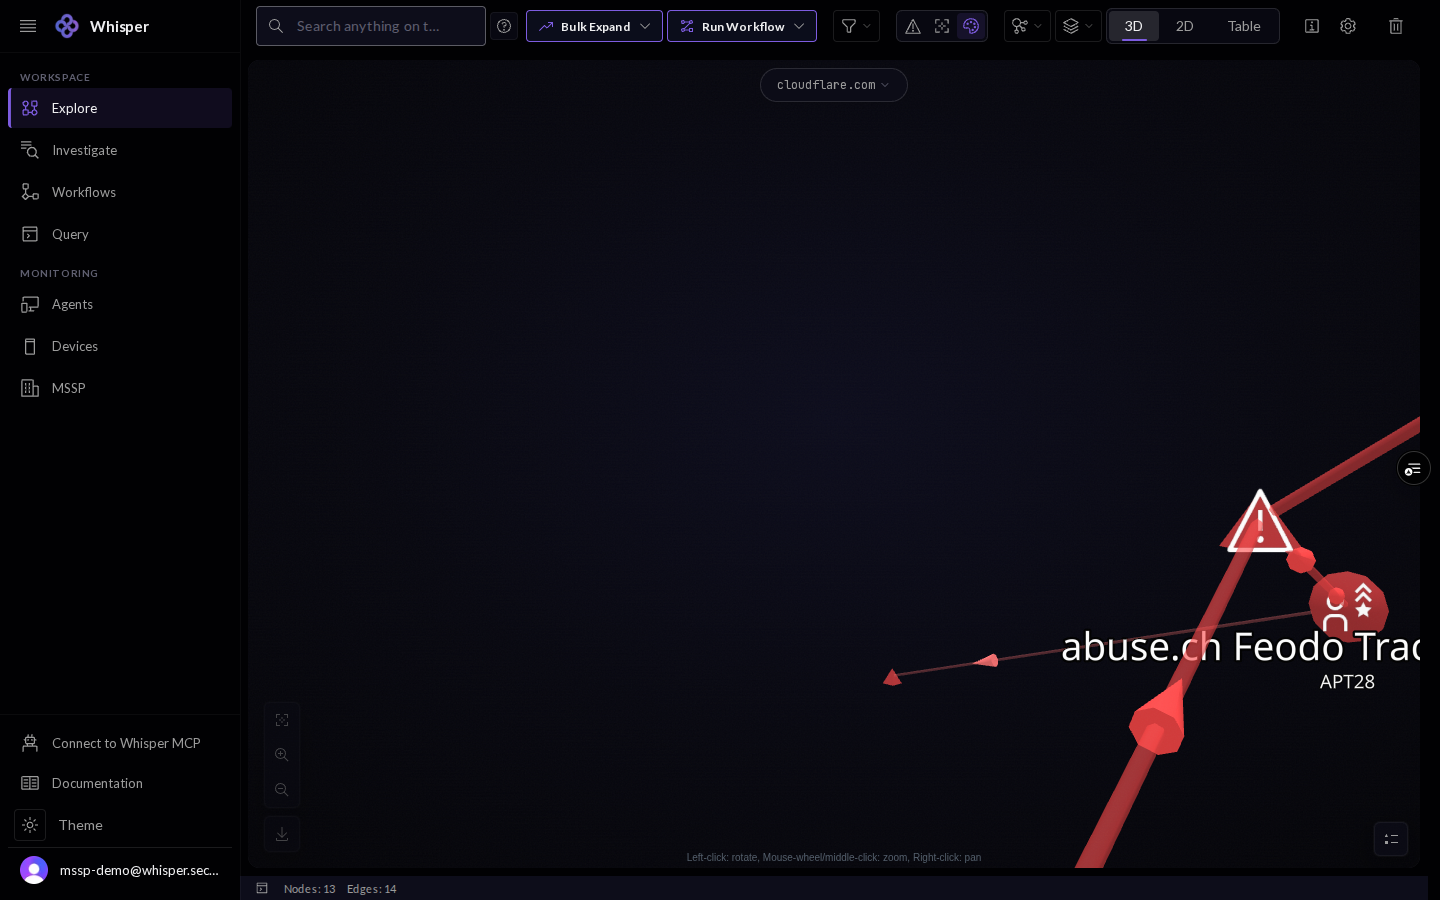
A 3D force-directed graph in the console, shown with demo data: connected nodes radiating from a seed domain, a top toolbar with Bulk Expand, Run Workflow, filter, layout, and 3D/2D/Table controls, and a node/edge count in the status bar.
The graph. The toolbar carries Bulk Expand, Run Workflow, filters, layouts, and the 3D/2D/Table switch; the status bar counts nodes and edges. Demo data.

3 · Node types

Nodes are colored by layer or by type. The legend groups them into Threat, Ownership, and Naming and DNS, with a live count per type: hostname, IPv4, IPv6, email, organization, TLD, registrar, prefix, announced prefix, ASN, and threat entities such as feed source, actor, and attack pattern.
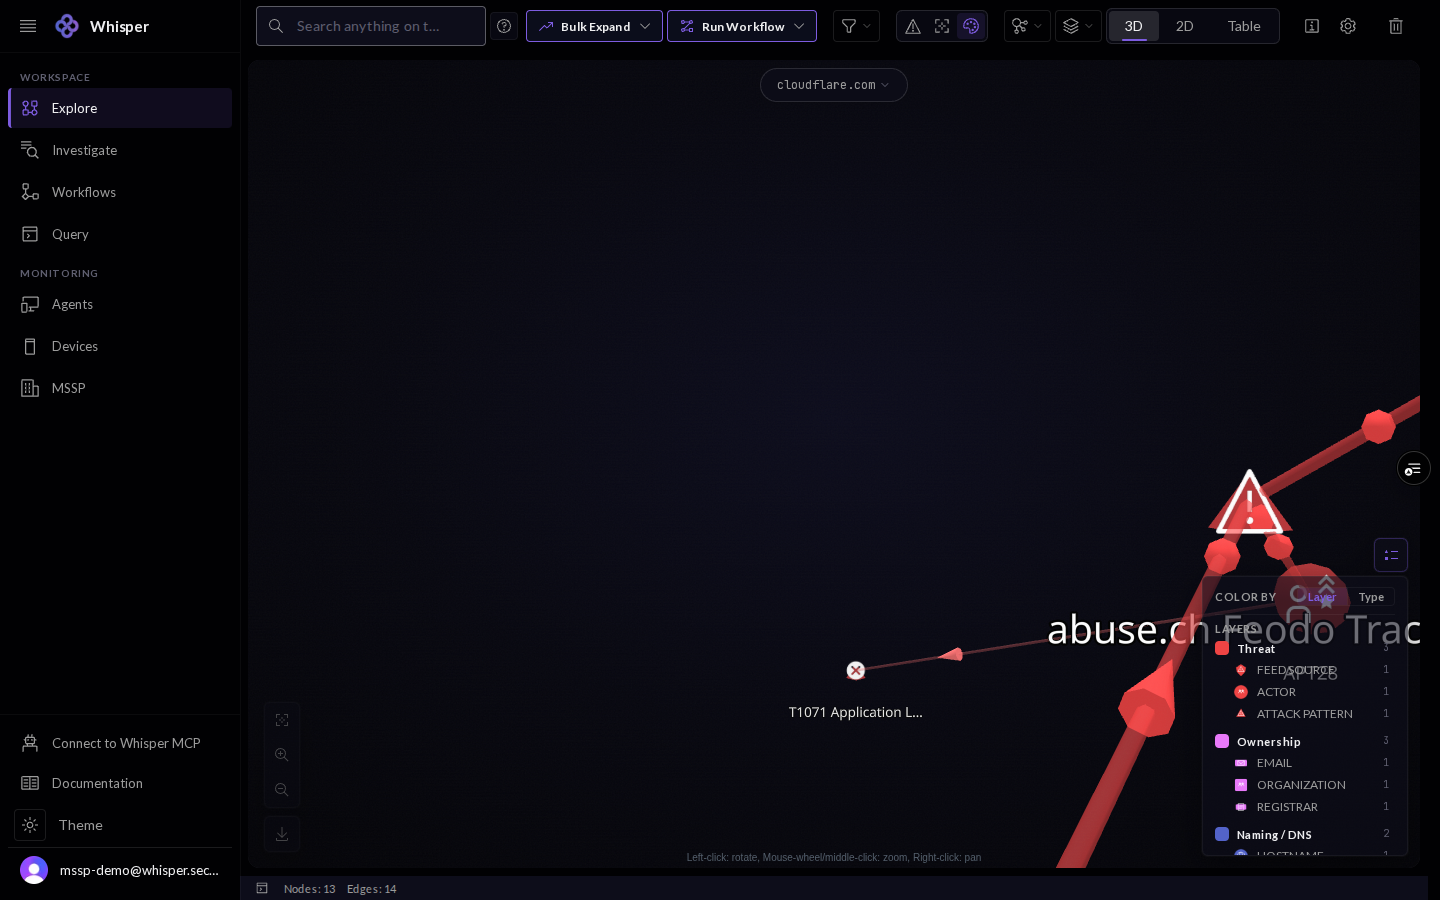
The color-by legend panel in the graph explorer, grouping node types by layer: Threat (feed source, actor, attack pattern), Ownership (email, organization, registrar), and Naming and DNS (hostname and more), each with a count.
The legend colors nodes by layer or by type: Threat, Ownership, and Naming and DNS, with a live count per type.

Select any node and its identifier anchors the focus bar at the top of the canvas.
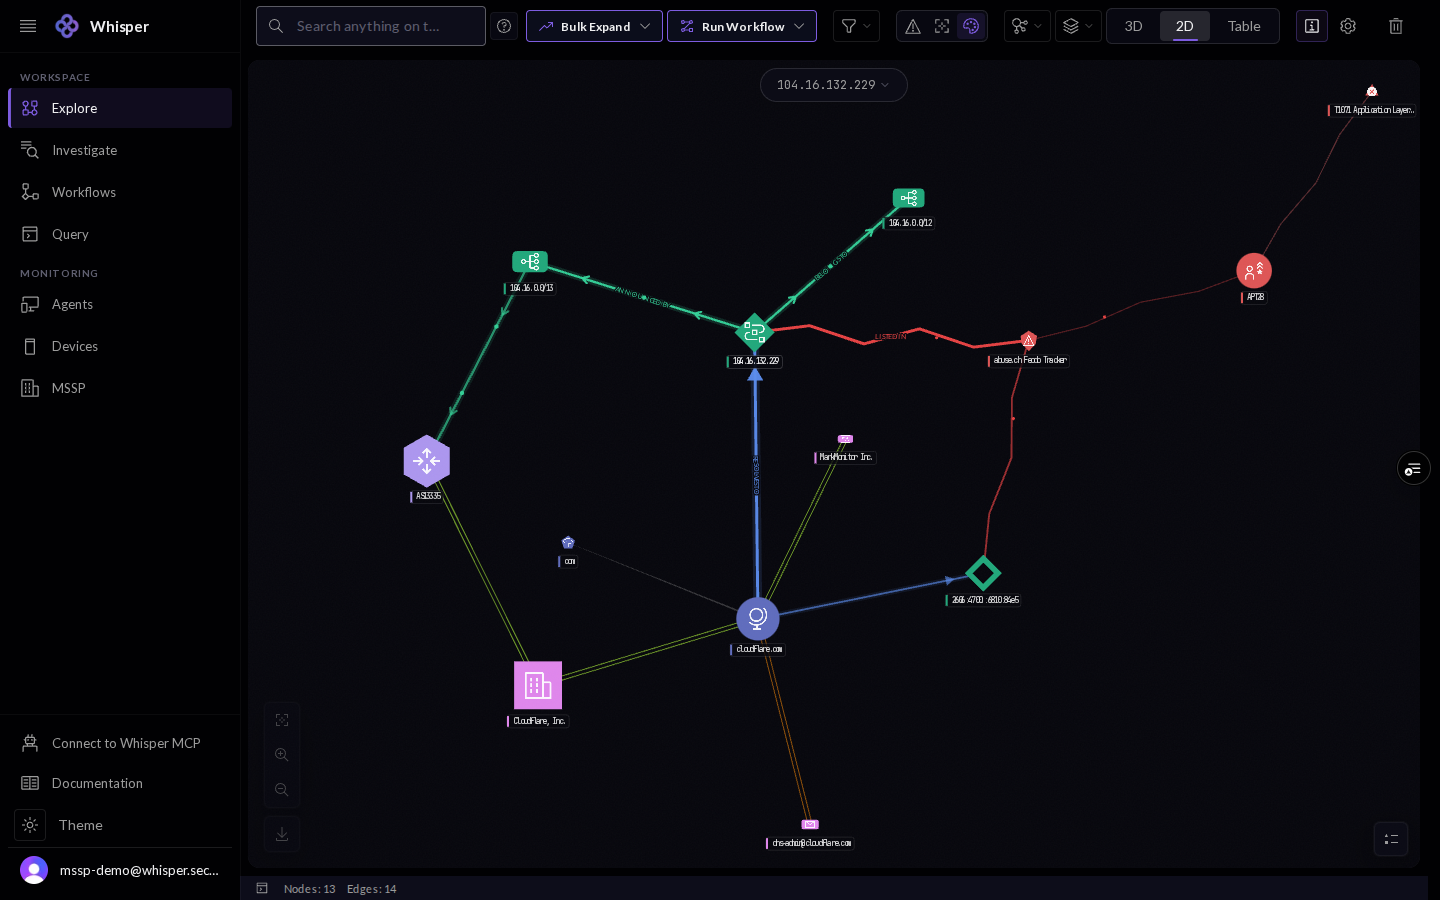
The graph with an IPv4 node selected: its address anchors the focus bar at the top of the canvas, and the node is emphasized among the connected infrastructure.
Select any node and its identifier anchors the focus bar. Every type, hostname, IPv4, IPv6, ASN, email, carries its own glyph and color. Demo data.

4 · Expand the graph

Grow the picture from any node. Bulk Expand can expand every node at once, collapse dense clusters into groups, or expand a single entity type at a time so the graph stays legible.
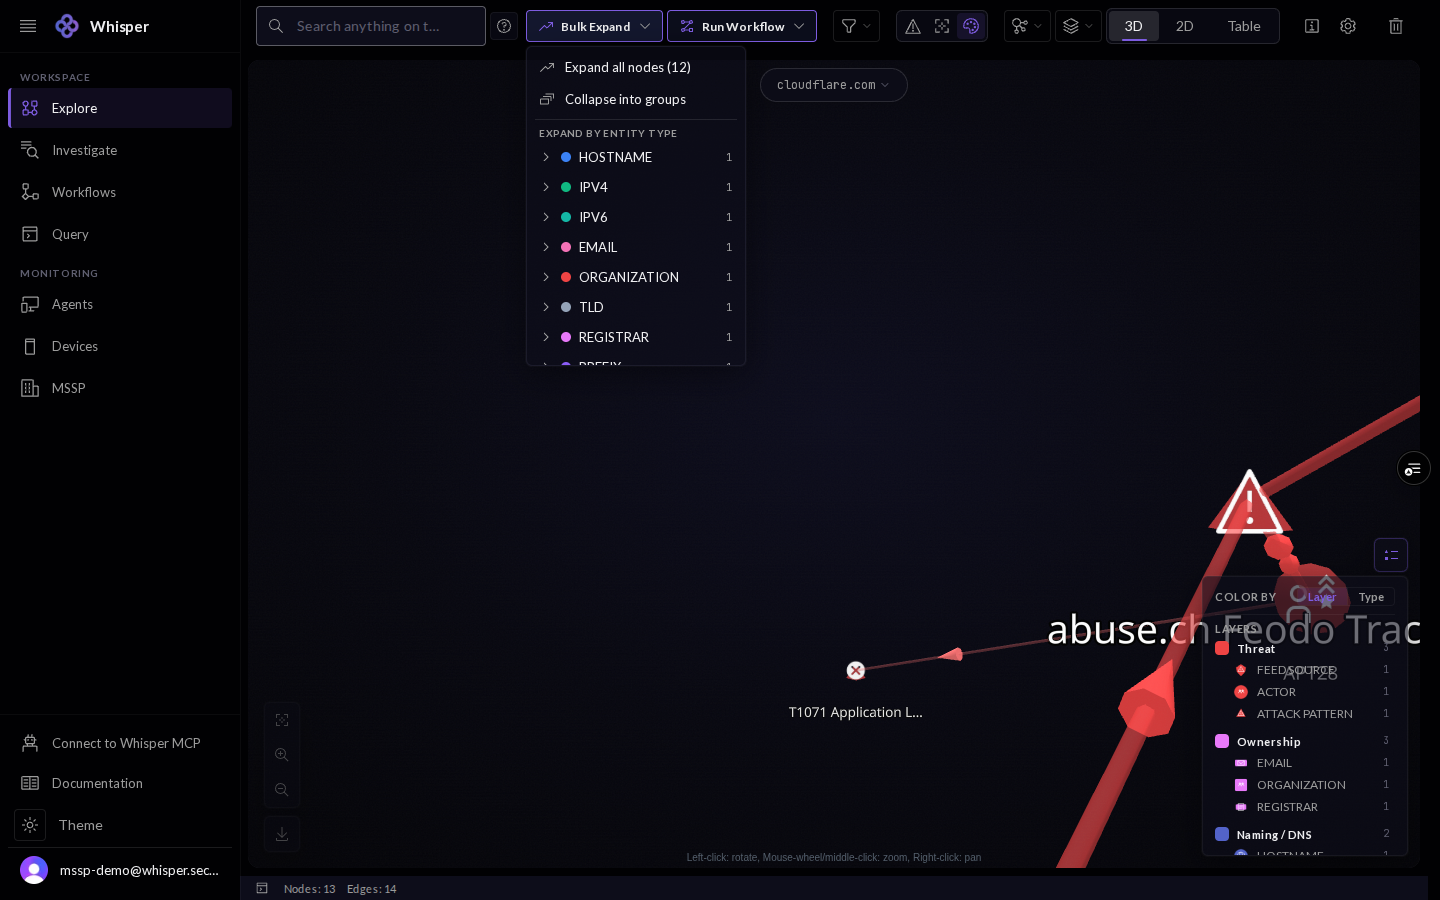
The Bulk Expand menu open in the graph explorer: options to expand all nodes, collapse into groups, or expand by entity type (hostname, IPv4, IPv6, email, organization, TLD, registrar, prefix), each with a count.
Bulk Expand grows the graph: expand everything, collapse into groups, or expand one entity type at a time.

5 · Filter

When the graph gets busy, filter which node and edge types are drawn. Each type shows a live count so you can hide the noise and keep the pivot in view.
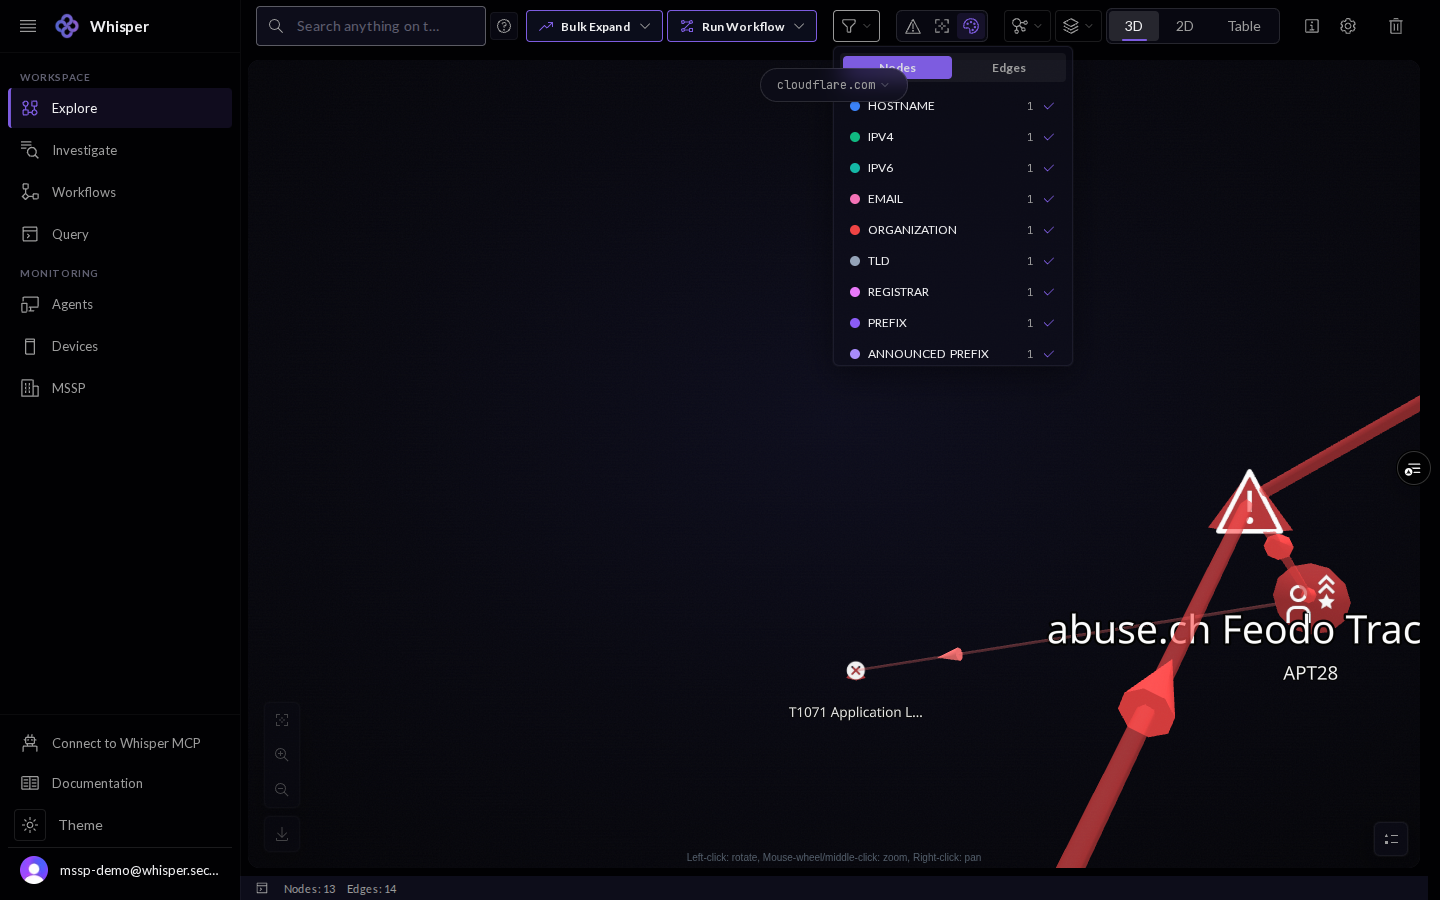
The filter panel open in the graph explorer, with Nodes and Edges tabs, listing each node type (hostname, IPv4, IPv6, email, organization, TLD, registrar, prefix, announced prefix) with a count and a toggle.
Filter which node and edge types are drawn, each with a live count.

6 · Layouts and views

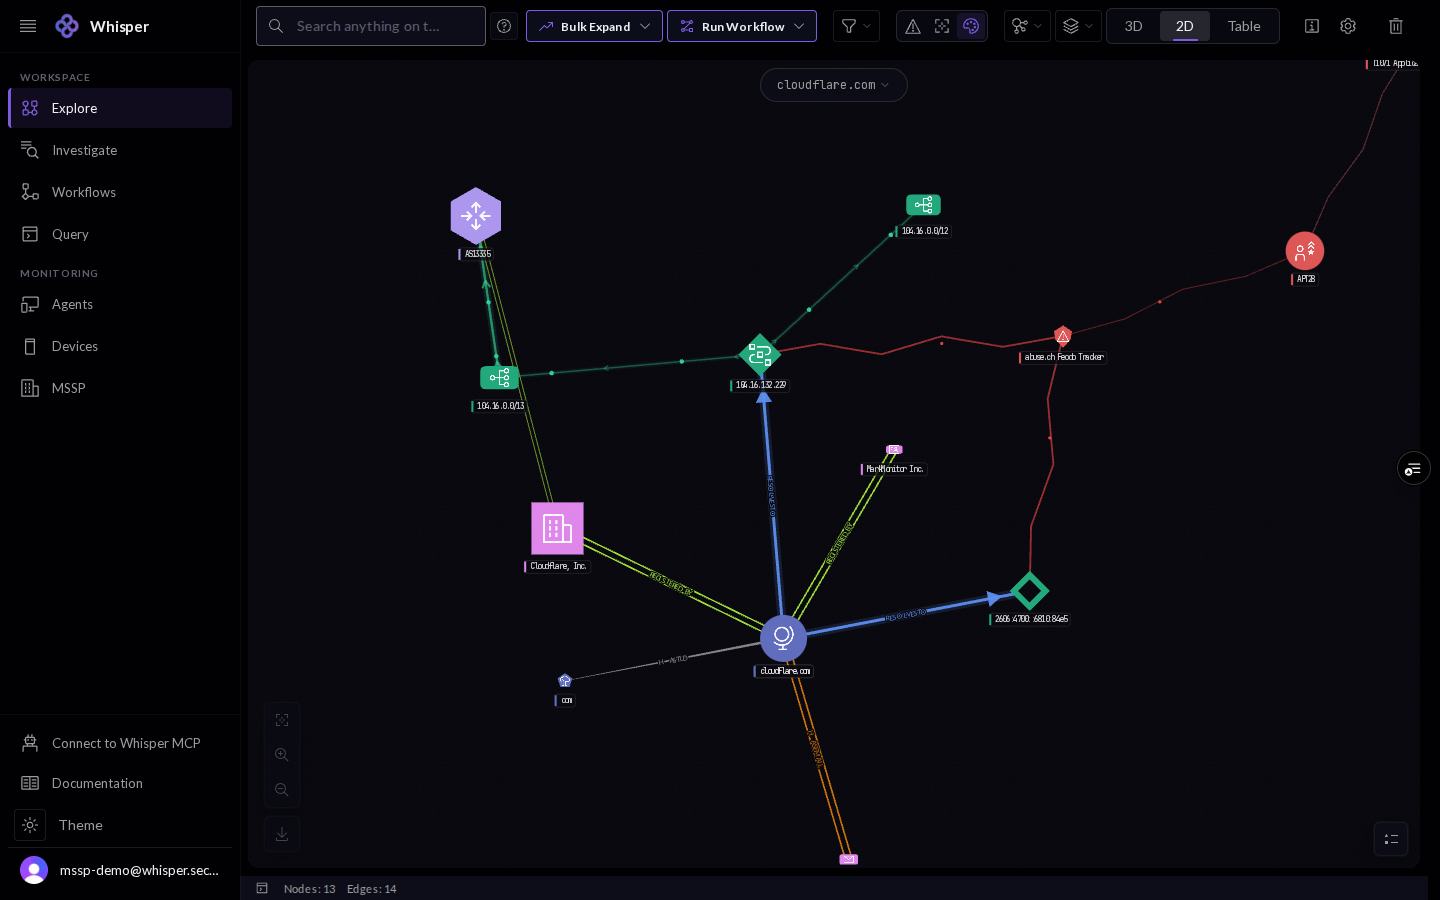
Four layouts arrange the same data differently: Force-Directed, Hierarchical, Radial, and Stratified. You can also drop to 2D, or leave the canvas entirely for a sortable table.
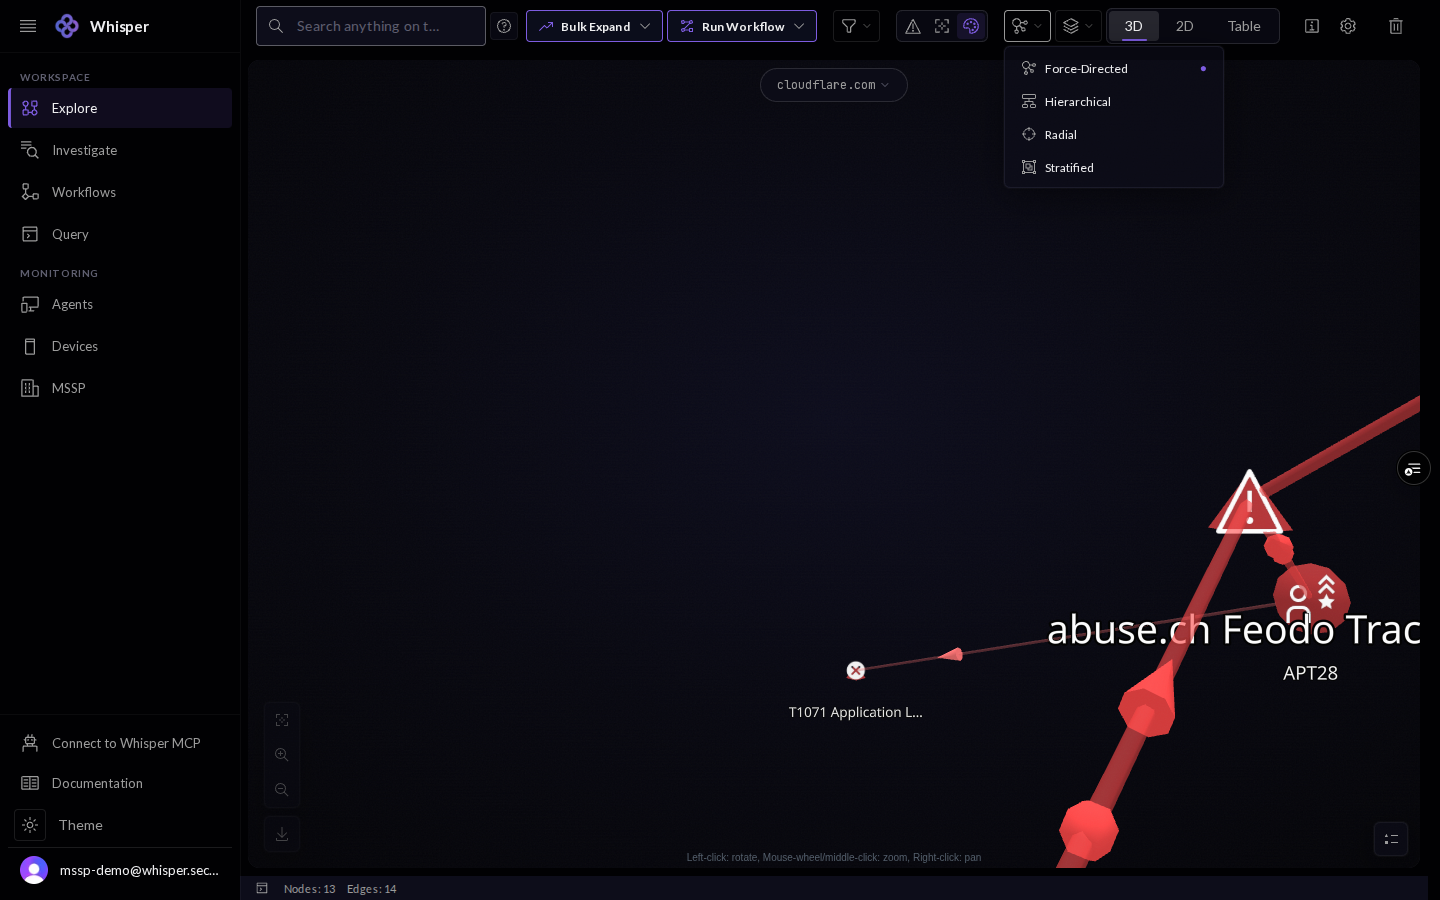
The layout menu open in the graph explorer: Force-Directed (selected), Hierarchical, Radial, and Stratified.
Four layouts: Force-Directed, Hierarchical, Radial, and Stratified.
The same graph rendered in 2D, with node types shown as distinct shapes and colors and every node labeled.
The 2D view of the same graph, node types as distinct shapes. Demo data.
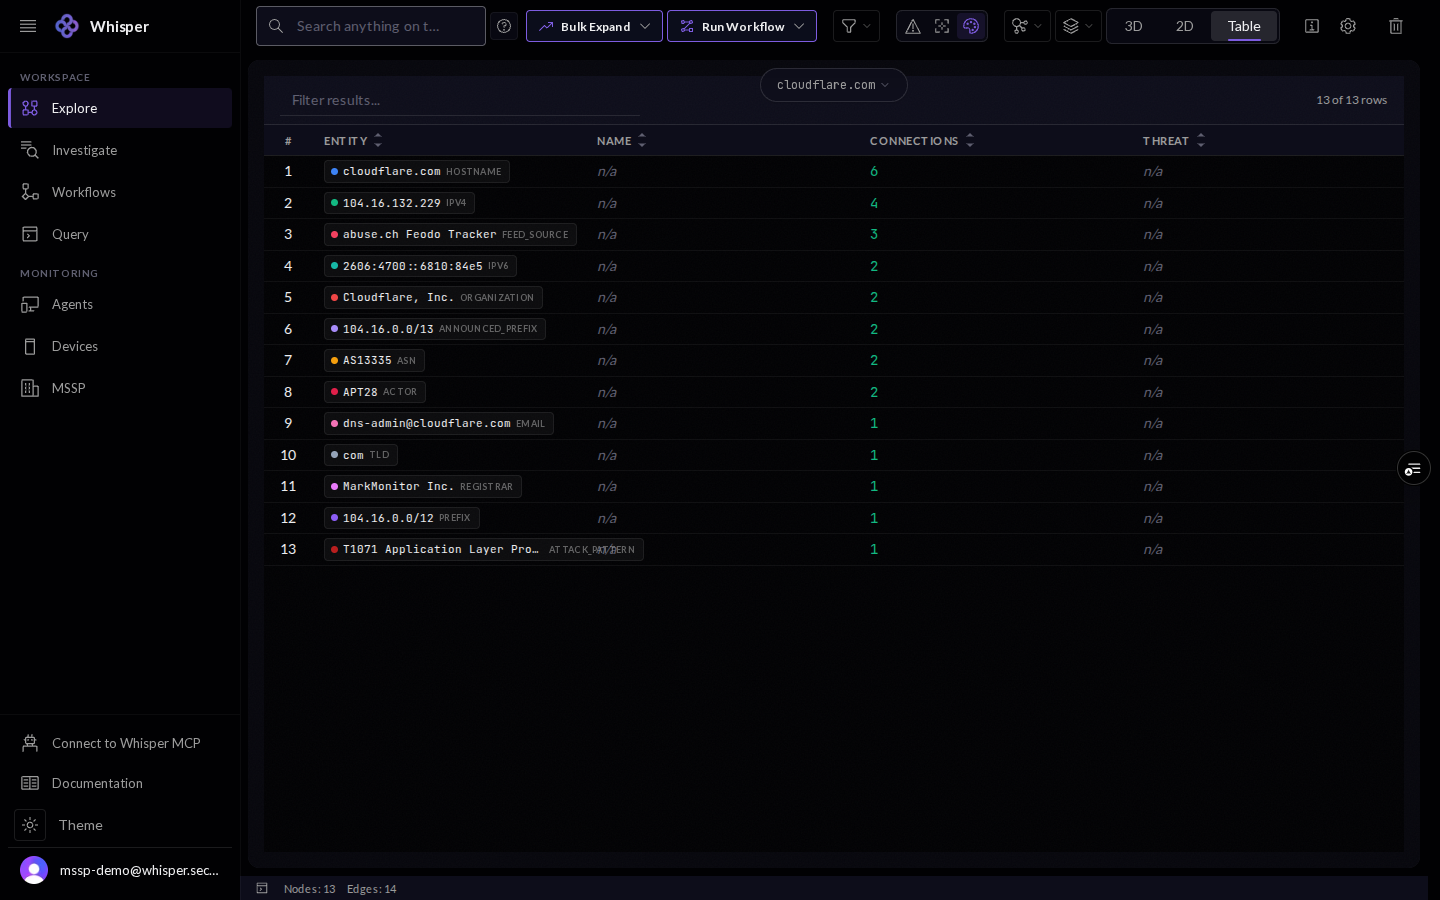
The graph shown as a table in the console: columns for entity, name, connections, and threat, sortable and filterable, with a row count.
The Table view: every node as a sortable, filterable row, with connection and threat columns. Demo data.

7 · Clear the canvas

Clear everything to start a fresh exploration. The console confirms first, so a full canvas is never lost by accident.
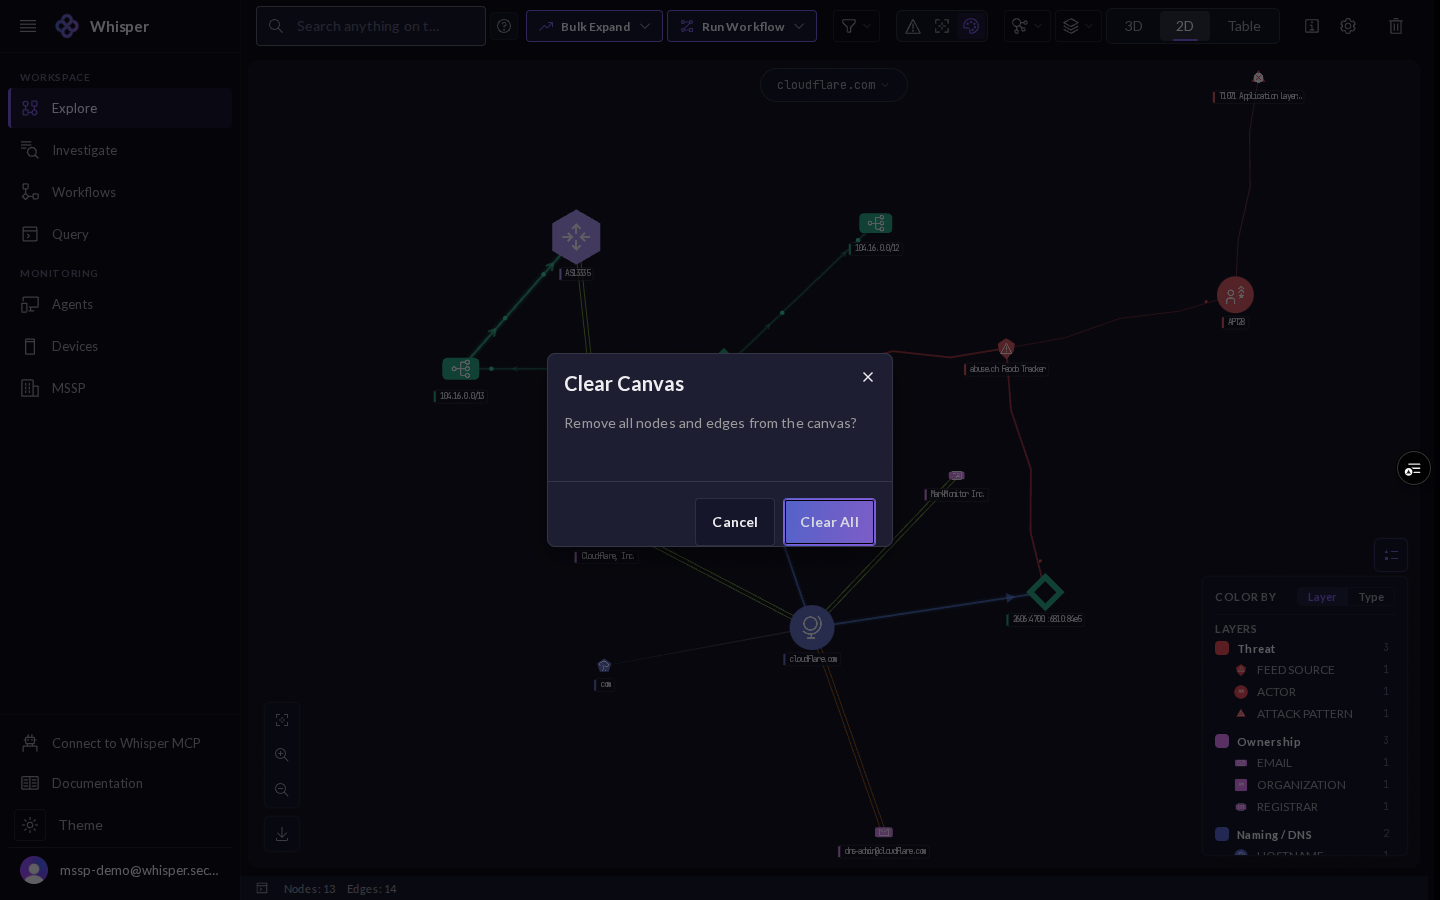
A Clear Canvas confirmation dialog asking to remove all nodes and edges from the canvas, with Cancel and Clear All.
Clear the canvas to start a fresh exploration.